Open Ticket
  +373 79 600002
  Telegram Live Chat
  F.A.Q
F.A.Q  English
 Русский
  Română
  Deutsch
  Français
  Türkçe
  Español
  Português
  Українська
  български
  Polski
  Indonesia
  中文 (中国)




























































































































 Hosting Information
502 Bad Gateway Explained: What It Means, Why It Happens, and How to Troubleshoot It
Keywords
This quick glossary covers the infrastructure words most likely to create confusion during the deeper explanation phase.
| Keyword | Brief explanation |
|---|---|
| 🌐 502 Bad Gateway | An HTTP error showing that one server could not use the response it got from the next server behind it. |
| 🚪 Gateway | A server that sits between the visitor and another service, passing requests onward. |
| 🔁 Proxy / Reverse Proxy | A front-facing server that accepts a request first, then forwards it to an internal service. |
| ⬆️ Upstream | The next server or service behind the proxy — the one expected to answer the request. |
| ⚙️ Backend | The application side doing the real work, such as an app process, service, or runtime. |
| 🏠 Origin | The server a CDN or edge service is trying to reach on behalf of the visitor. |
| ⚖️ Load Balancer | A front layer that distributes requests across one or more backend targets. |
| ☁️ CDN / Edge | A network layer closer to visitors that may cache, filter, or forward traffic before it reaches the origin. |
| 🧭 DNS | The naming system that helps a hostname resolve to the server address a service should use. |
| 🔐 TLS | The encryption and identity layer behind HTTPS; a mismatch here can break server-to-server handoffs. |
| 🔌 Port / Socket | The network endpoint or local socket path where the backend is supposed to listen for connections. |
Why a 502 Error Feels So Disruptive
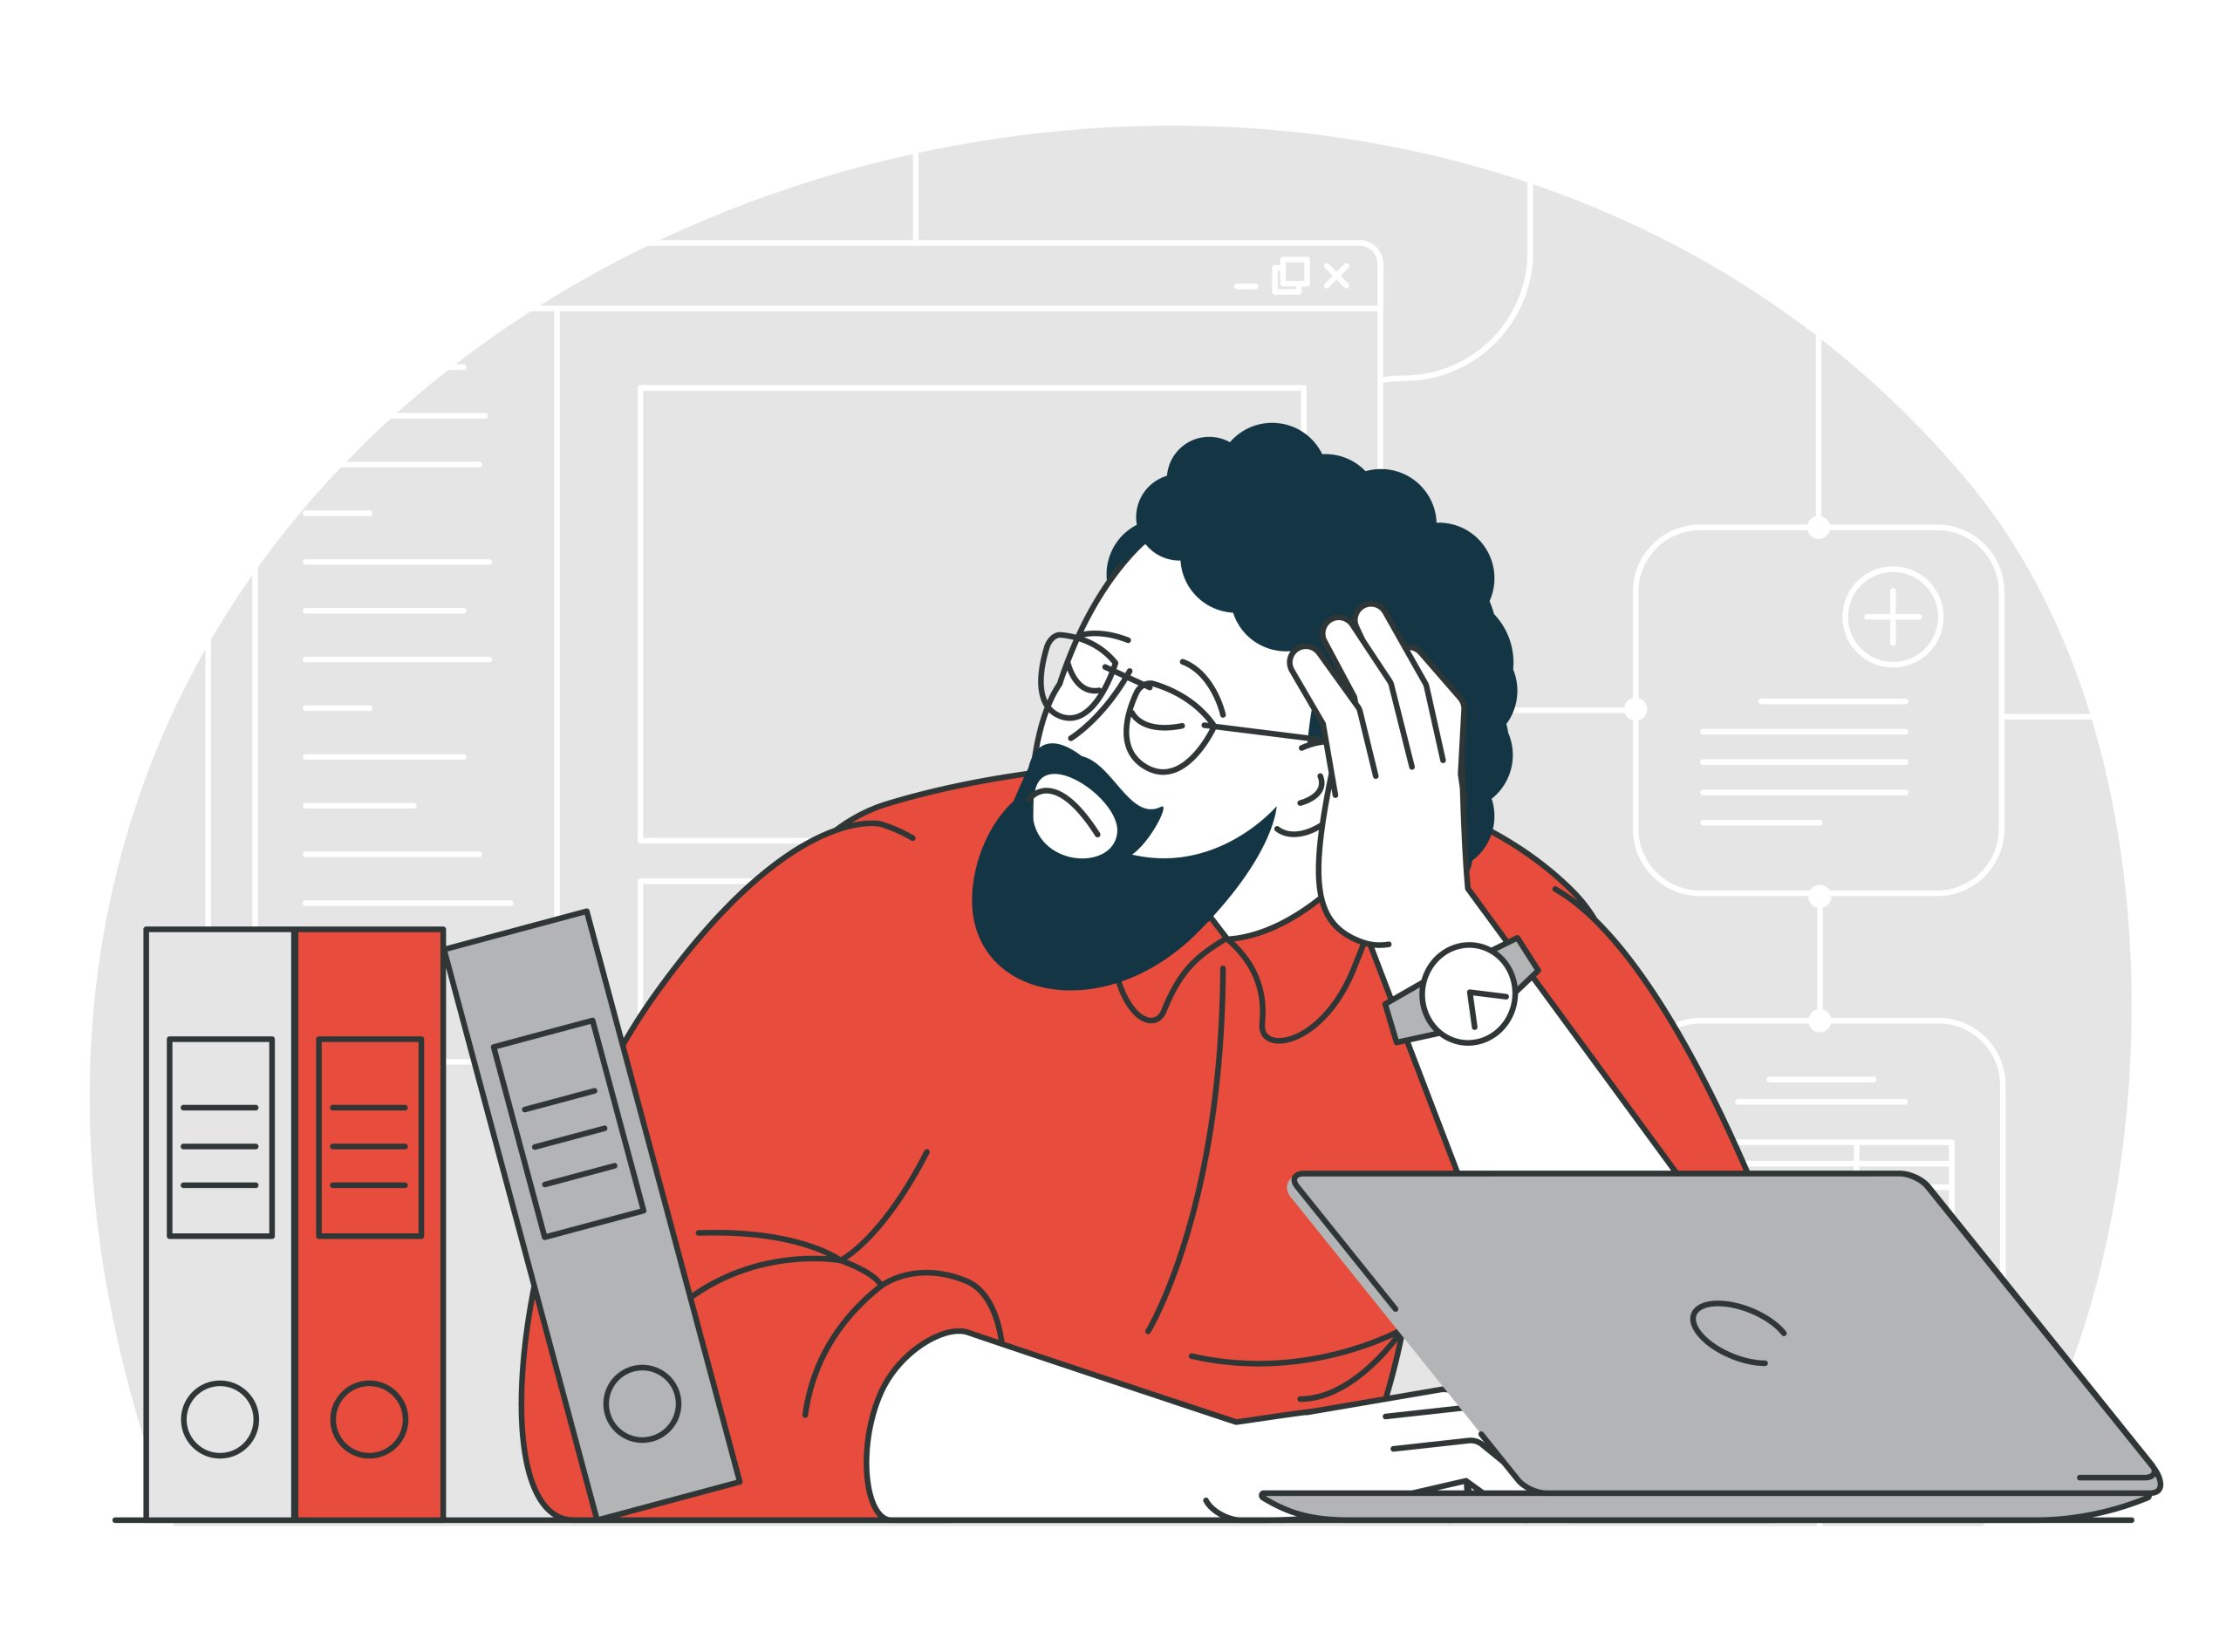
You push a deployment, reload the site, and the domain answers instantly — just not with your application. Or a customer clicks Checkout, the page loads, and the transaction dies behind a stark 502 Bad Gateway message. That is what makes this error so stressful: the site is reachable, but not healthy enough to complete the handoff.
A 502 sits in an awkward middle state. It does not look like total disappearance, but it also does not behave like a working service. For developers, it can mean a broken deploy or API chain. For business owners, lost trust or interrupted revenue. For teams, the worst part is often ownership: which layer actually owns the problem?
The useful way to approach it is not to guess. First, define what the error means. Then map where it lives in the request chain. Then troubleshoot the failure logically, one handoff at a time. Once you can see the chain, the error stops looking random.
What 502 Bad Gateway Actually Means

A 502 Bad Gateway error usually means a server acting as a gateway or proxy could not use the response it got from the next layer behind it. In plain English: one server tried to hand your request to another server, and that handoff failed badly enough that the front-facing server could not return a normal result.
📝 Note: If the upstream returns a valid HTTP error of its own, the proxy will usually pass that error through. If the app returns a real 503 Service Unavailable, the front layer should normally relay that 503, not invent a 502. A 502 means the response itself was unusable. If no usable response arrives in time, that is often a 504 instead.
The fastest way to stop misreading 5xx errors is to separate them by where the failure lives and what question they trigger first:
| Status | What failed | Where the failure sits | Best first question |
|---|---|---|---|
| 500 | The application or origin hit an internal error while handling the request | Inside the app or origin service itself | What broke inside the application? |
| 502 | A gateway or proxy received an invalid or unusable response from the next hop | At the handoff between layers | Which server handed the request off, and what came back? |
| 503 | The service is temporarily unavailable or refusing work | At the service that should handle the request | Is the service overloaded, down for maintenance, or intentionally unavailable? |
| 504 | A gateway or proxy did not get a timely response from the next hop | At the same handoff zone as 502, but with timeout semantics | Did the upstream fail to answer before the timeout window closed? |
⚠️ Warning: Do not collapse 500, 502, 503, and 504 into one generic “server down” bucket. They point to different failure shapes, and that changes what you should check first.
Once that definition is clear, the next question becomes much more useful: where in a real stack does this failed handoff actually happen?
Where the Error Happens in a Real Request Chain

Most modern requests do not travel straight from browser to application. They cross layers: browser to CDN or edge, edge to reverse proxy or load balancer, proxy to the application process. A 502 becomes visible at one of those handoff points.
Simplified request chain: Browser → CDN/Edge → Reverse Proxy / Load Balancer → App / Process
A reverse proxy accepts the public request and forwards it internally. A load balancer does something similar, but may choose between multiple healthy targets. In both cases, the front layer is routing the request, not doing the business logic itself.
The front-desk analogy works well here. Think of the proxy as the front desk in an office building. It checks in the visitor, looks up the correct office, and tries to hand the visitor off. If the office does not answer, answers on the wrong line, or gives a response the front desk cannot use, the front desk returns the failure. That is why the visible error often appears at the proxy layer even when the deeper cause lives elsewhere.
📝 Note: The proxy is often the messenger of the failure, not the original cause.
The “next server” behind that front desk can be a normal HTTP service on a port, an application listener such as 127.0.0.1:3000, or a local socket-backed process such as PHP-FPM. The root problem does not have to live in the proxy. A bad deploy, a crashed app worker, or even a database failure can break the backend badly enough that the proxy is simply where the 502 surfaces.
Edge services add one more twist. A CDN such as Cloudflare can forward an origin-side 502 from deeper in your stack, or it can generate a 502 itself when the edge-to-origin handoff fails. That is why “who returned this error?” is the first practical question, not an afterthought.
Why 502 Errors Happen: The Main Failure Categories

Once you stop treating a 502 as one mysterious event, the cause landscape gets much easier to manage. Most incidents fit into three reusable buckets: the upstream is unavailable, the handoff itself is misconfigured, or the response comes back in a form the gateway cannot use.
| Category | Example failure | What you usually test next |
|---|---|---|
| Upstream unavailable | App process crashed, service stopped, unhealthy target after deploy | Is the service running, and is anything listening where the proxy expects it? |
| Handoff mismatch | Wrong port, wrong socket path, wrong protocol, DNS failure, firewall block, TLS mismatch | Is the proxy pointing to the right place with the right protocol and route? |
| Unusable response | Malformed headers, oversized headers, premature close, connection reset, overload side effects | What do logs, direct tests, and timeout or header settings show? |
The first bucket is the obvious one: the upstream is not there in a usable state. Maybe the application crashed after deployment. Maybe the service never restarted. Maybe a PHP-FPM pool died, or a target was marked unhealthy and removed from rotation. This is the classic “service down” scenario, but it is only one slice of the 502 landscape.
The second bucket is the handoff mismatch. Here, both layers may be running, but they disagree about how to reach each other. The proxy may point to the wrong port. A hostname may resolve incorrectly. A firewall may block the path. One layer may expect HTTPS while the next only speaks plain HTTP. A socket path may have changed. In these cases, the app can be healthy and the connection between layers is still broken.
The third bucket is trickier: the upstream answers, but not in a way the gateway can use. A target can reset the TCP connection, close it too early, send malformed or oversized headers, or return partial output under load. The app is not simply “off”; it is responding badly enough that the gateway rejects what it got.
This is also why 502 is not just a timeout story. Some timeout cases become 504 Gateway Timeout, not 502. Cloudflare can surface edge-generated 502s when origin connectivity or compression breaks. Load balancers can emit 502s during deregistration timing issues or TLS handshake failures. “Service down” is one cause category, not the definition of the error.
That mental model gives you a real checklist before you ever touch a config file. Ask which bucket you are probably in, then test for evidence. That is what makes the troubleshooting sequence feel logical instead of ritualistic.
A Smart Troubleshooting Sequence for 502 Errors

The fastest way to troubleshoot a 502 is to identify which layer returned it, then test the next hop behind that layer before changing anything. The point is to prove where the failed handoff lives.
💡 Tip: Before you restart or edit anything, identify who returned the 502. A clean attribution step often saves more time than the first five “fixes” people try under pressure.
Phase 1: Identify the layer
Start at the public side and ask what the internet-facing layer is actually returning:
curl -I https://example.comThis shows the HTTP status and headers from the public URL. If the headers clearly belong to a CDN, load balancer, or reverse proxy, you have your first clue. If the error page is Cloudflare-branded, Cloudflare may have generated the 502 itself; if it is unbranded, the edge may simply be passing through an origin-side failure. Headers such as cf-error-type or cf-error-origin can appear on Cloudflare-generated error pages, which is useful precisely because they do not appear on every 502.
📝 Note: If only one visitor sees the error while others can reach the site, local VPN, proxy, firewall, or DNS settings can still be part of the problem. A 502 is usually server-side, but an isolated client path can muddy what you are observing.
Phase 2: Verify the upstream path
Once you know which layer returned the 502, test the next hop behind it. If a reverse proxy is involved, confirm that both the proxy and backend service are running, and confirm that the expected listener exists:
systemctl status nginx
systemctl status <app-service>
ss -tlnp
Replace <app-service> with your backend service name. systemctl status tells you whether the proxy or application process is alive, failing, or restarting. ss -tlnp shows whether something is actually listening on the port you expect.
Then test whether the backend answers directly without the proxy in the middle:
curl -i http://127.0.0.1:3000If the direct request works but the public URL still returns 502, the backend may be healthy and the handoff may be the real problem. That points you toward proxy target settings, protocol mismatches, upstream hostnames, TLS expectations, or firewall rules rather than the app code alone.
Phase 3: Use commands as proof, not ceremony
After the direct checks, move to evidence that explains why the handoff is failing:
journalctl -u nginx -u <app-service> --since "15 min ago"
dig +short example.com
nginx -t
These three checks answer different questions. journalctl surfaces recent crashes, resets, timeout hints, and deployment-related failures. dig +short tells you whether the hostname you depend on resolves the way the server expects. nginx -t validates reverse-proxy syntax before you reload anything, which matters because a bad upstream definition can manufacture a 502 even when the backend is fine.
The practical signals usually look like this:
| Signal | What it suggests | Next check |
|---|---|---|
| Public curl -I returns 502 from a CDN or edge | The edge may be generating the error or forwarding it from origin | Determine whether the edge page is branded and compare with origin-side availability |
| Direct curl to 127.0.0.1:3000 works, but public URL fails | The backend answers, but the proxy or load balancer handoff is wrong | Inspect upstream target, protocol, TLS, and proxy config |
| systemctl status <app-service> shows failed or inactive | The upstream is unavailable | Review recent logs and the last deploy or restart event |
| ss -tlnp shows nothing on the expected port | The service is not listening where the proxy expects it | Confirm bind address, port, socket path, and startup config |
| journalctl shows resets, header issues, or premature closes | The response is reaching the gateway in a broken form | Correlate proxy logs with app logs and inspect response or header behavior |
| dig +short returns the wrong host or no answer | Name resolution is part of the handoff failure | Fix upstream hostname, DNS records, or resolver path |
That is the core pattern to remember: identify the layer, verify the next hop, then use logs and direct tests to explain the mismatch. Evidence first. Settings second.
How the Troubleshooting Path Changes by Hosting Model

The next move after a 502 depends on how much of the stack you control. The troubleshooting logic stays the same, but the amount you can inspect yourself changes a lot between shared hosting, VPS, dedicated servers, and edge-proxied setups.
| Environment | What you can usually inspect | When to escalate |
|---|---|---|
| Shared hosting | Limited logs, control-panel status, reproducible URL or time pattern | Early — especially if you cannot inspect proxy or service logs directly |
| VPS | Services, ports, logs, reverse-proxy config, firewall, local DNS | After you confirm the issue is outside your own service or config path |
| Dedicated server | Full stack plus deeper network and system responsibility | When the issue points to provider network, hardware, or upstream dependencies outside your control |
| CDN / edge-proxied setup | Edge behavior, headers, branding clues, origin reachability | Once you know whether the edge generated the error or forwarded it |
📝 Note: On shared hosting, escalation is not a cop-out. It is often the correct technical move because the layers that matter most for a 502 may be outside your visibility.
On shared hosting, the most useful thing you can do is collect evidence: the time, the affected URL, whether the error is constant or intermittent, and whether it started after a deploy or configuration change. That gives support something actionable. If you do not control the reverse proxy, the app service, or the server logs, meaningful layer-by-layer diagnosis ends quickly.
On a VPS, the full workflow becomes realistic because you can inspect services, listeners, logs, and proxy configuration directly. That is where reverse-proxy troubleshooting belongs. On AlexHost VPS infrastructure, checking systemctl, journalctl, ss, upstream targets, and Nginx configuration is part of normal ownership, not something always hidden behind support.
A dedicated server gives you the same visibility, but with more responsibility. You own more of the full stack, and possibly more of the surrounding network assumptions too. If you add a CDN or other edge service in front, the first ownership question remains the same: did the edge generate the 502, or did it forward an origin-side failure? More control does not make troubleshooting simpler by default. It gives you more places to inspect.
Think in Layers, Not in Panic

A 502 Bad Gateway error stops feeling mysterious once you treat it for what it usually is: a failed server-to-server handoff, not a random browser event. The browser is only where you notice it. The real story lives in the layer handing the request to the next one and failing to get back something usable.
So keep the sequence simple: identify the layer, check the next hop, validate with direct tests and logs, and change settings only when the evidence points somewhere specific. If recurring incidents keep pushing you toward deeper log, proxy, and service visibility, that is the point where higher-control environments — including AlexHost VPS or dedicated servers — become useful for operational reasons, not marketing ones. Method beats memorization here.